The Housing Shortage in Simple Charts
And maps of the housing crisis across the decades
This first chart, showing new privately-owned housing units started (red) and completed (blue) divided by total households, might be the ultimate documentation of the U.S. housing shortage. Dividing by households rather than population is important because one household inhabits one housing unit (at least in theory) and U.S. household size is shrinking over time as fewer individuals marry and have children. Multigenerational families are presumably far less common now than they were during, say, the progressive era heyday of immigration. Part of me wonders how much expensive housing delays or limits marriage and childbirth, on the margin (extremely high density seems to discourage parenthood, a topic for a future post).
We clearly see that the U.S. has been starting and finishing fewer homes, with inflection points in the 1980s and around 2005. The lines are going back up, but 1990 is the last time they were anywhere near as low as they were in 2023. And in 2023 we see starts actually dip below completes, presumably because the Fed started raising interest rates in 2022.
One of my basic theses is that the housing market should be able to deliver units at significant scale without near-zero interest rates, which are a phenomenon unique to the 21st century. From around 1970 to 1985ish we see huge ups and downs; maybe some of you, dear subscribers, have war stories of epic booms and busts during that era of real estate.
Another way to break down the shortage is housing units completed each decade:

Maybe, technically, the 1970s should run from 1971 to 1980 but regardless, we see a clear downward trend over time, except for the 2000s building boom, which looks quite modest in the first chart. Please note that I divided the 2020s number by four (years of data) then multiplied by ten (years in a decade) for rough comparison. Once again, we see that America simply builds fewer homes than it did in decades past. And to catch up, we will have to start building many more.
With the caveat that generations are a largely arbitrary concept, Pew assumes that millennials were born from 1981 to 1996. We are famously the largest generation in U.S. history. Many of us hit the job market in the nadir or aftermath of the great recession, and reached our 20s and 30s around the time the meaning of “housing crisis” was transitioning from “my house lost value” to “I, a young professional with a decent job, might never be able to afford to buy a house.”
Someone born in 1981 was ~24 in 2005, when housing production collapsed, then stagnated for more than half a decade. The baby boomers who spend their days advocating against zoning reforms routinely brush off younger people’s frustrations about housing …
… Yet our protestations are not whining, laziness, or unrealistic expectations. They are a normal reaction to the empirically observable reality of a dire housing shortage.
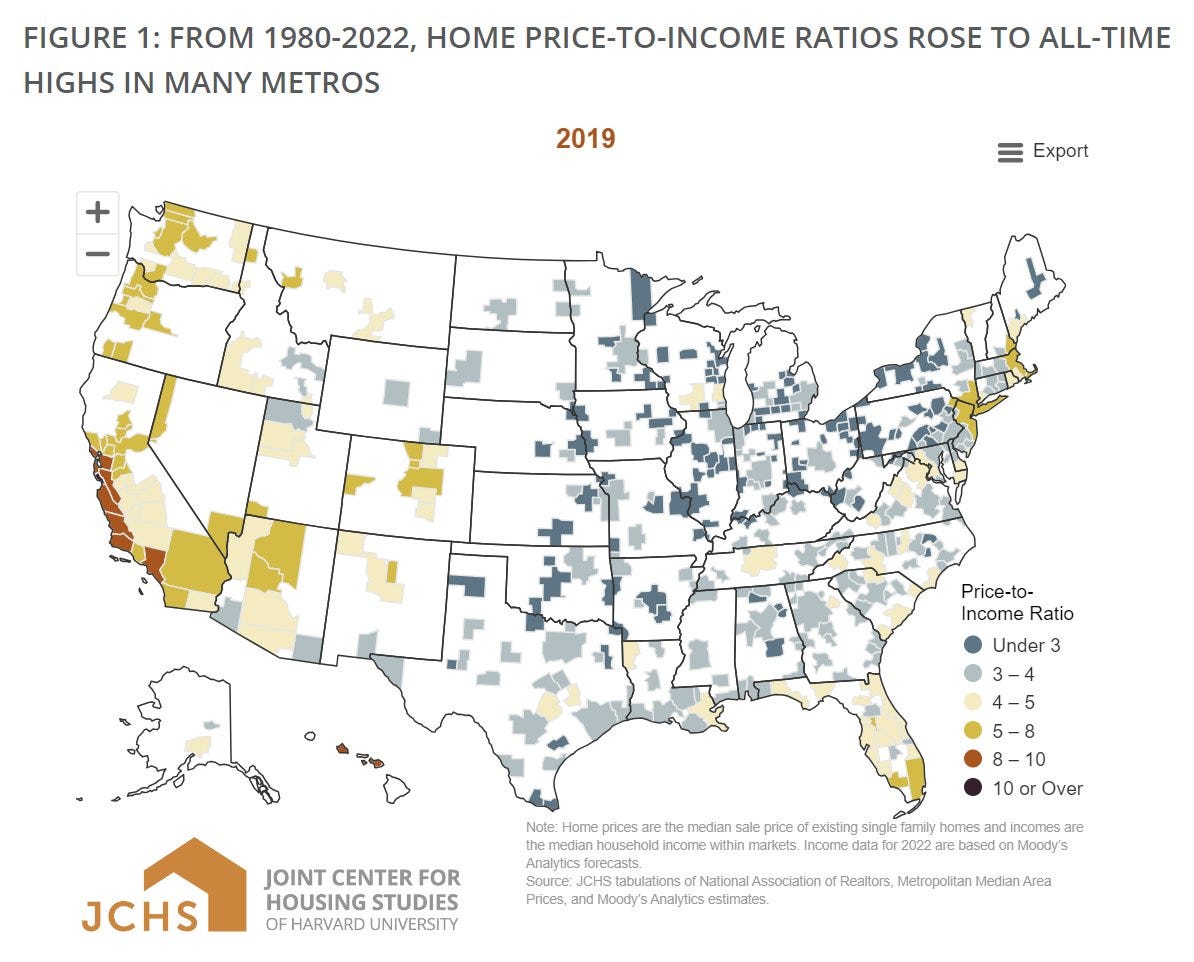
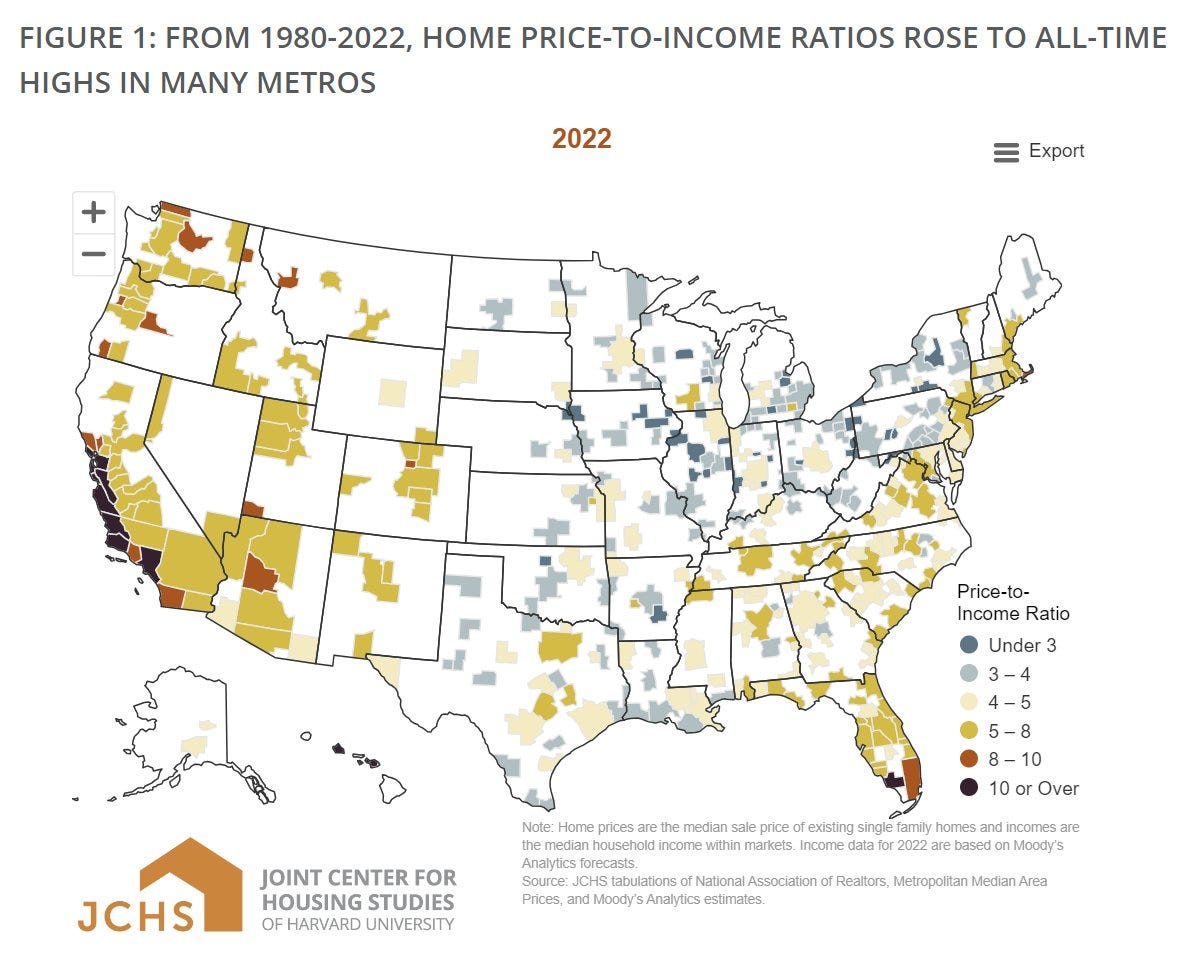
The housing shortage is a literal shortage and, as we will now see in this series of maps, there really is a nationwide affordability crisis after decades of slowing home construction.
We begin in 1980 when coastal California was pioneering the disconnect between home prices and incomes. I take this as evidence that people not being able to afford a home they bought only a few years prior is a new, ahistorical phenomenon.
Two decades hence, a few areas, mostly the northeast and what looks to be Denver, had started to feel the squeeze. I grew up in South Carolina, so I can tell you the yellow at the bottom of the Palmetto State is Beaufort County, known for its resort and retirement enclaves (plus Parris Island, one of two U.S. Marine boot camps).
By 2019 there was a national “coastal” housing crisis, though Nevada and Arizona were also faltering, despite being two (reputed) epicenters of late 2000s overbuilding (or “overbuilding” with air quotes as
might prefer).And of course by 2022 the bottom had fallen out. Supply chain issues were snarling housing production, while any part of the country people had any interest in moving to was swamped by demand. Note well that coastal California got worse. In the race to the bottom, its only competition is Hawaii and Collier County in South Florida.
The basic necessity of shelter has become exponentially more expensive over time.
Now, as a bonus, we can truly appreciate indices for home prices and monthly rent:
The basic necessity of shelter has become exponentially more expensive over time.
Thanks to my 399 subscribers, especially my 11 paid subscribers. If you enjoy this blog or want to work together, especially on my concept for a real estate financing platform, please contact lucagattonicelli@substack.com. Check out YIMBYs of Northern Virginia, the grassroots pro-housing organization I founded.


If we can’t build housing with these interest rates, wait and see us build even less if we stop immigration and don’t have workers to build homes.